Click here to download the Annual report
St. James Parish
117 Hudson Avenue
Chatham, New York 12037
Annual Financial Report to Parishioners
For Fiscal Year Ended
June 30, 2025
October 2025
Dear Parishioners,
The Finance Council presents to you the Annual Report for the Fiscal Year Ended (FYE) June 30, 2025. The report provides the operational results for the recently completed fiscal year. It is important to note that the financial report for the Church (Exhibit A) excludes revenues and expenses related to the operation of the Colbert House as this information is reported in Exhibit B. The two financial reports are presented in a format that compares the information to the prior fiscal year's operational results.
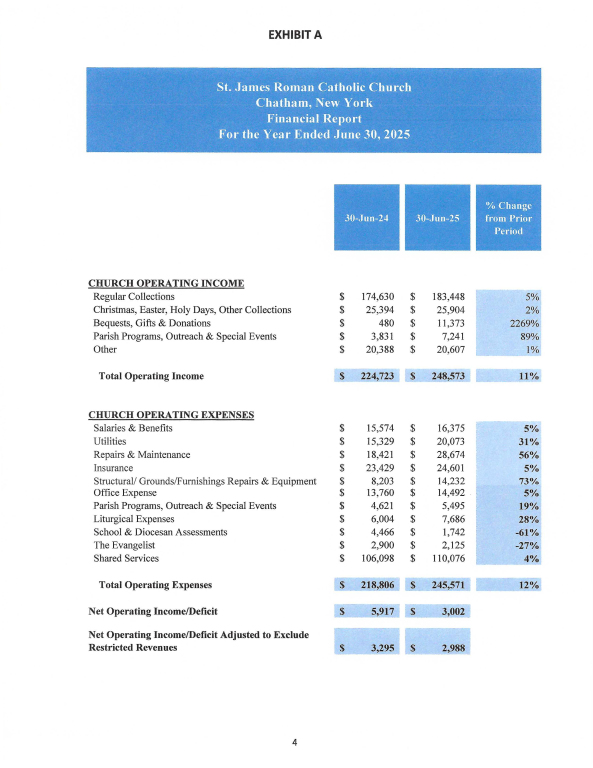
Exhibit A
The Fiscal year's operational results were a net operating income of $3,002.
Factors contributing to the operating net income are highlighted below.
➢ Overall revenues decreased 11% as compared to the prior year. This can be directly attributed to an increase in total collections, capital campaign fundraising, and the receipt of a significant bequest.
-
-
- Revenue from various regular offertory collections (weekly, utilities, holy days, etc.) increased 4.7% as compared to the prior year. The regular weekly offertory collections increased 5%.
- Other revenues increased 59.4% primarily due to the capital campaign fundraising and bequest.
-
➢ Overall operating expenses increased 12% as compared to the prior year.
-
-
- Utility expenses increased 31% primarily attributed to a significant increase in electricity expense.
- Property Insurance expense increased 5%.
- The combined Repairs & Maintenance Expenses and Structural/Grounds/Furnishings Repairs and New Equipment Expenses increased 61%. This can be primarily attributed to the resealing and remarking of the Church's two parking lots, required repairs and inflationary increases.
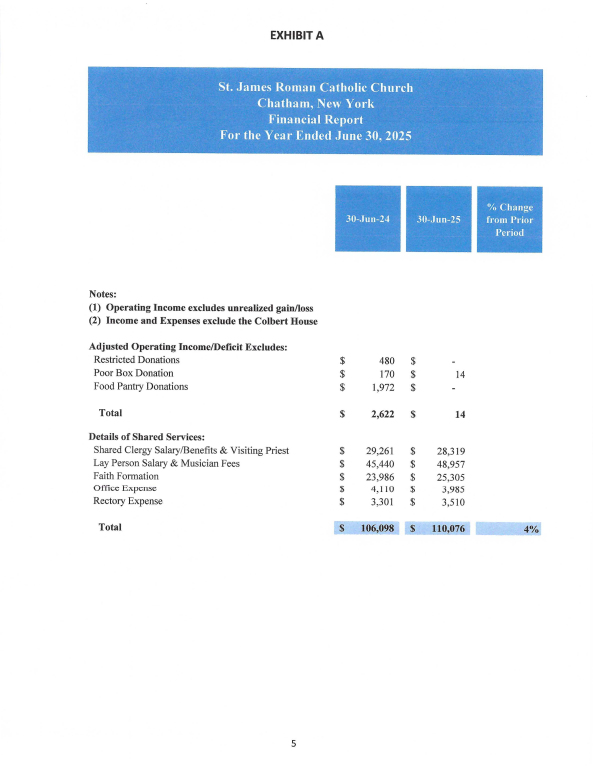
- Shared services expenses increased 4% as compared to the prior year.
- Most other increases to expenses are directly related to inflationary increases.
-
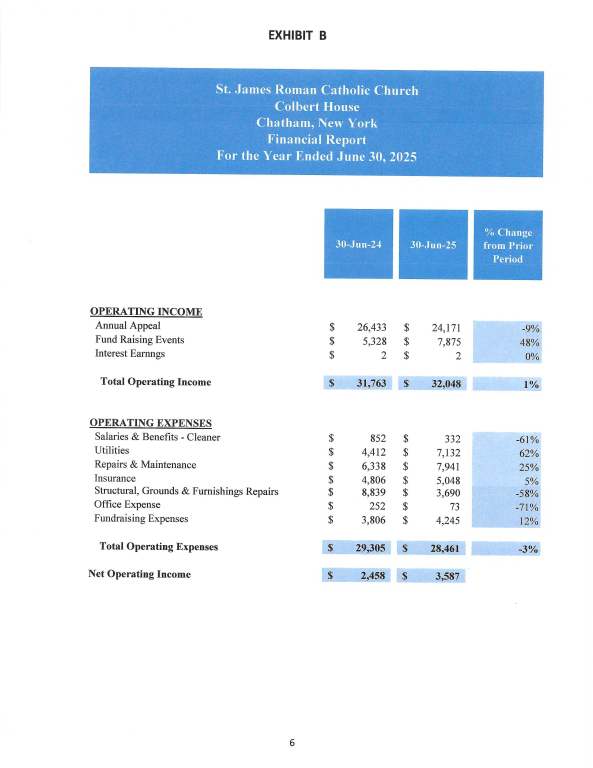
Exhibit B
The Colbert House operational results were a net operating income of $3.587.
Factors contributing to the net operating income are highlighted below.
➢ Overall revenues increased 1%.
➢ Operating expenses increased 3%.
-
-
-
-
- Insurance increased 5%
- Utility expenses increased 62% due to increase utilization of the house.
- Tree removal and trimming was required.
-
-
-
The council would like to thank the entire St. James community for your past and future stewardship (time, talent, and financial). Due to the continued good stewardship, we are able to continue to advance the mission of the St. James Parish. May God bless you and your families.
Sincerely,
Fr. Steve Matthews, Pastor Philip Mossman, Council Member
James Forster, Council Chair Teresa Ribaneneyra, Council Member
Denise Berry, Trustee Betty Sundstrom, Council Member
Mickey Dennis, Council Member Janis Wallace, Council Member